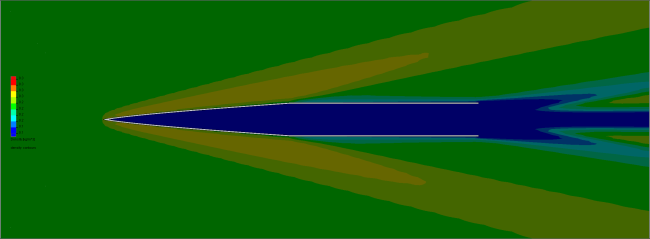
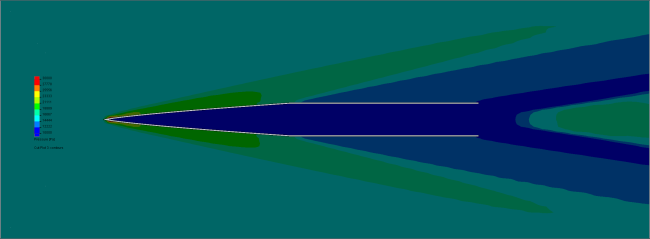
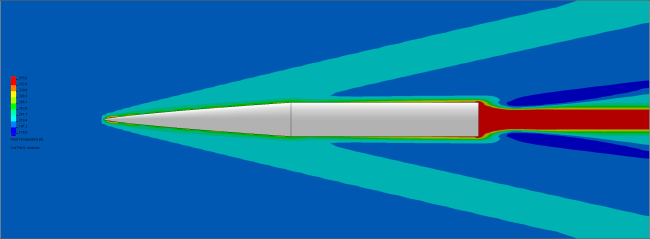
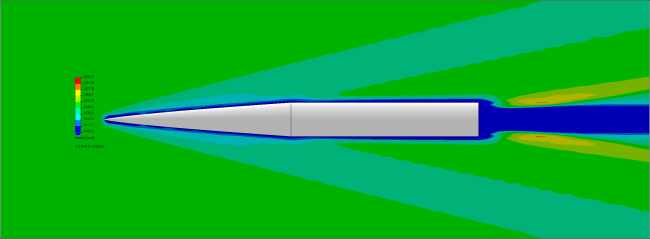
Richard asked if I could do some simulation of the nose cone heating of the Double Sugar Shot rocket. It’s quite a big nose cone, nearly a meter long by 169mm diameter (~3ft by 6.65″). I modeled it in Solidworks, then ran it in Solidworks Simulation. With my current computer, it takes a few days for it to complete a run, then a few days more to get time to check the results and re-run it if anything was off. Following is the final results of one run.
I was given a few points with altitude, velocity, temperature, pressure, and density. I calculated dynamic pressure.
| Altitude (m) | Velocity (m/s) | Temp (K) | Pressure (Pa) | Density (kg/m^3) | Dynamic pressure (Pa) | Mach number |
| 827 | 344 | 282.8 | 91777 | 1.131 | 66898 | 1.02 |
| 2022 | 532 | 275.0 | 79278 | 1.004 | 142116 | 1.60 |
| 8056 | 360 | 235.8 | 35312 | 0.522 | 33808 | 1.17 |
| 9955 | 780 | 223.4 | 26619 | 0.415 | 126247 | 2.60 |
| 11750 | 1112 | 216.7 | 20108 | 0.323 | 199903 | 3.77 |
| 13703 | 1445 | 216.7 | 14771 | 0.238 | 247967 | 4.90 |
The last point had the highest dynamic pressure (also known as “max Q”) for the data points given, so I ran it in the simulation as it may have the most interesting results. That point is 1445 m/s at 13703 m MSL. For the simulation input I used air as the fluid at the density at that altitude; 14771 Pa and 216.65 K. I set the surface roughness to 6.35 micrometer, which should be appropriate for a finish equivalent to smooth paint.
Here’s a video of one result, followed by charts of others. Click to embiggen.
The shockwave coming off the cone is prominent in all the plots, and raked back at a severe angle due to the high velocity. The temperature is relatively low, aside from a small warm area just downstream of the nose.
Here the analysis wasn’t set to deal with conduction in solids, so it’s impossible to give temperatures for the solid part, just for the gas touching the part. It does bound the maximum temperature the part could reach, which is a reasonable design point, but it isn’t as interesting as having a plot of the actual expected part temperatures.
To analyze the heat going into the nose cone its material properties must be defined. These include:
- Density
- Specific heat (possibly at multiple temperatures)
- Conductivity type (Isotropic, Unidirectional, Asymmetrical/Biaxial, or Orthotropic)
- Thermal conductivity (which can also vary with temp and can be multiple, if not isotropic)
- Melting temperature (the glass transition temperature of the resin would be a good analog for a composite nose cone)
The thickness of the nose cone would also need to be known, especially if it varies at different positions.
For the next analysis I will shorten the length of the straight tube to just a few inches, close the end so that the flow inside isn’t taking calculation cycles, and possibly change the size of the bounding box to remove the volume downstream of the nose.
A full simulation can also be done with time dependent variables. The velocity, temperature, and pressure can all be varied with time to get an idea of the total heating over the flight. However that analysis would probably take weeks for the computer to run. It’d be interesting to try, though.


